Why CloudWatch Alarms Go Silent
CloudWatch alarm debugging has gotten complicated with all the “just check your threshold” advice flying around. As someone who spent a genuinely embarrassing number of 3 a.m. sessions staring at green dashboards while production was on fire, I learned everything there is to know about why these alarms go quiet. Today, I will share it all with you.
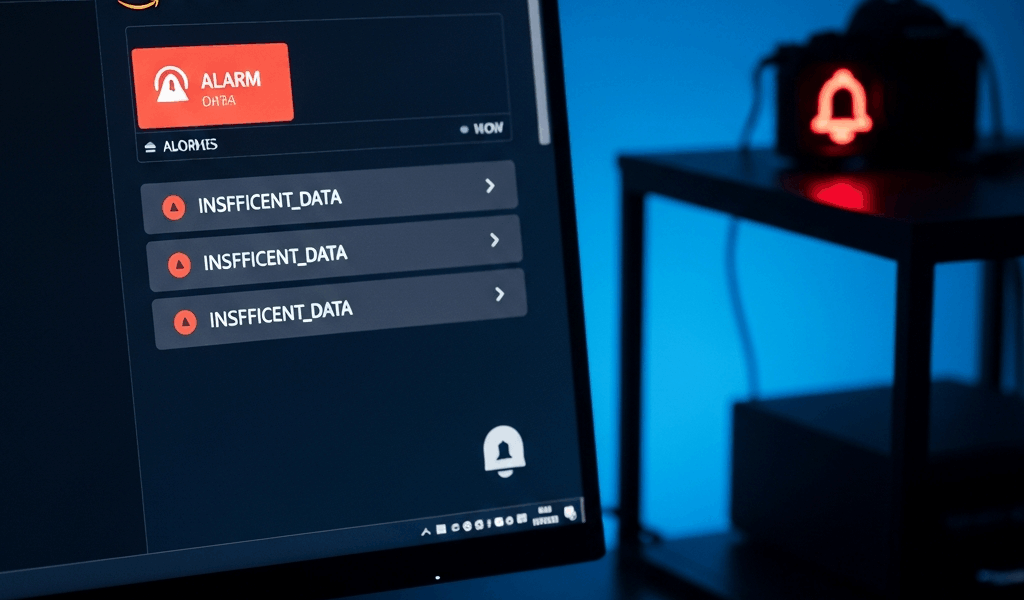
The failures cluster into three buckets — dirty ones, at that. Your metric has no data, or the alarm is interrogating dimensions that don’t exist. The alarm configuration has a hidden gotcha, usually that INSUFFICIENT_DATA state that looks harmless until you realize it means the alarm evaluated nothing. Or the alarm fired correctly and SNS swallowed the notification whole, maybe because a confirmation email expired six months ago and nobody noticed.
Most guides stop at threshold math. That’s not useful at 3 a.m. This one walks through exact console paths and CLI commands to diagnose each failure mode fast — under ten minutes if you know where to look. So, without further ado, let’s dive in.
Check If the Metric Is Actually Receiving Data
Start here. Full stop. An alarm watching an empty metric will never fire.
Open the CloudWatch console, go to Metrics, and search your metric namespace. Filter by resource tag or instance ID — whatever narrows it fastest. Pull up the graph. Flat line or data gaps? That’s your problem, probably. But flat doesn’t automatically mean no data. Sometimes it means the alarm is watching a dimension that quietly stopped existing.
Here’s the trap I fell into with an ELB alarm — cost me about two hours I’ll never get back. The namespace was correct. Dimensions looked right. But the alarm was querying a TargetGroup name that changed during a redeployment three weeks earlier. The metric kept publishing under a new dimension value. The alarm saw nothing and sat there looking green while request errors climbed. Infuriating.
Use the CLI to verify what data is actually flowing:
aws cloudwatch get-metric-statistics \
  --namespace AWS/EC2 \
  --metric-name CPUUtilization \
  --dimensions Name=InstanceId,Value=i-0abc123def456 \
  --start-time 2025-01-10T00:00:00Z \
  --end-time 2025-01-10T01:00:00Z \
  --period 300 \
  --statistics Average
Swap in your namespace, metric name, dimensions, and time range. Empty datapoints array coming back? The metric isn’t receiving data, or your dimension is wrong. Cross-check the exact dimension name and value against what’s showing in the console graph.
Dimension names are case-sensitive and unforgiving. It’s InstanceId, not instance-id. Custom metrics pushed via the CloudWatch API are the worst offenders here — I’m apparently very bad at consistent casing and it has bitten me repeatedly. The dimension structure you use on publish has to match exactly what the alarm queries. Don’t make my mistake.
Fix the INSUFFICIENT_DATA State Trap
Probably should have opened with this section, honestly. This one catches everyone at least once.
But what is INSUFFICIENT_DATA? In essence, it’s the alarm telling you it evaluated the metric and found no datapoints to compare against the threshold. But it’s much more than that — it’s a silent trap, because many engineers see this state and assume things are fine, just quiet. They’re not fine. The alarm is not evaluating at all. Nothing is being checked.
Find your alarm’s “Treat missing data as” setting. Open the alarm configuration in the console and scroll down. Four options live there:
- missing — Treats absent datapoints as failures. Use this when you want to alert if the metric stops reporting entirely.
- notBreaching — Treats absent datapoints as OK. The default, and usually what you actually want.
- breaching — Treats absent datapoints as alarm-triggering events. Aggressive, but valid for critical zero-tolerance metrics.
- ignore — Skips evaluation for missing periods entirely. This setting is a silent killer in disguise.
An alarm stuck in INSUFFICIENT_DATA while configured to “ignore” will never transition to ALARM state — even after data resumes flowing. Fix it via CLI:
aws cloudwatch put-metric-alarm \
  --alarm-name my-cpu-alarm \
  --metric-name CPUUtilization \
  --namespace AWS/EC2 \
  --statistic Average \
  --period 300 \
  --threshold 75 \
  --comparison-operator GreaterThanThreshold \
  --evaluation-periods 1 \
  --treat-missing-data notBreaching
Run that with your values updated and the alarm re-evaluates immediately. If data is flowing and the threshold is breached, you should see the state flip to ALARM within seconds. That’s the confirmation you want.
Evaluation period math matters too — and it trips people up constantly. If your alarm requires 3 evaluation periods but the metric only has 1 datapoint in that window, you get INSUFFICIENT_DATA. The formula: evaluation periods × period in seconds = minimum time window required. Two evaluation periods at 300 seconds each means you need a full 10 minutes of data before the alarm can make any decision whatsoever.
Verify Your SNS Topic and Action Are Configured Correctly
The alarm state changes perfectly. The metric breaches. Everything looks correct in the console. And then silence — nothing reaches your inbox. That’s what makes this failure mode so endearing to us infrastructure people. It works, technically, and also doesn’t work at all.
First, check regions. Your SNS topic and your CloudWatch alarm must live in the same AWS region. I once built an alarm in us-east-1 pointing at an SNS topic in us-west-2 — a $0.00 mistake that cost about four hours of confused debugging. AWS does not error on cross-region topic references. It fails silently. Verify the topic ARN in your alarm config includes the correct region code before moving on.
Second, open the SNS console, pull up your topic, navigate to Subscriptions, and look at the status next to your email address. “PendingConfirmation” means the confirmation email AWS sent weeks ago never got clicked. Resend it. Check your spam folder this time — AWS confirmation emails have a remarkable talent for landing there.
Third, permissions. CloudWatch needs explicit IAM authorization to publish to your SNS topic. Custom KMS encryption keys and restrictive resource-based policies will silently block it. Add this statement to your SNS topic’s resource-based policy:
{
  "Effect": "Allow",
  "Principal": {
    "Service": "cloudwatch.amazonaws.com"
  },
  "Action": "SNS:Publish",
  "Resource": "arn:aws:sns:us-east-1:123456789012:my-topic"
}
Update the region, account ID, and topic name to match yours. Find the Access Policy tab on your SNS topic in the console and drop that statement in.
Quick Diagnostic Checklist Before You Give Up
- Metric namespace and name are correct — Pull it up in the console and confirm datapoints actually appear on the graph.
- Dimension names and values match exactly — Run get-metric-statistics to confirm data exists under the precise dimension you’re querying.
- Alarm threshold makes sense for your actual metric range — A threshold of 1000 on a metric that maxes out at 100 will never trigger. Ever.
- Evaluation periods and period duration are right — Do the math. Do you actually have enough datapoints in that window?
- “Treat missing data as” is not set to “ignore” — Common. Quiet. Deadly.
- SNS topic is in the same region as the alarm — Cross-region references fail silently with no error to chase.
- SNS subscription is confirmed — PendingConfirmation blocks every single message.
- Check alarm history directly — Run
aws cloudwatch describe-alarm-history --alarm-name my-alarm --max-records 10to see exact state transitions and the reason codes behind them.
Nearly all of these are configuration mismatches — not AWS failures, not mysterious cloud behavior. The describe-alarm-history command is your sharpest tool here. It shows you exactly when the alarm state changed and why, which cuts through the noise faster than anything else in this list.

Stay in the loop
Get the latest team aws updates delivered to your inbox.